Disease mapping is critical planning tool for researchers
September / October 2013 | Volume 12, Issue 5
Scientists can more productively study how to combat an infectious disease - including the use of vaccines - if they know its location, prevalence and tendencies, but all too often such information is based on poor-quality or dated estimates. This prompted a team of researchers at Oxford University to seek a way to more accurately assess disease prevalence in specific locations around the world.

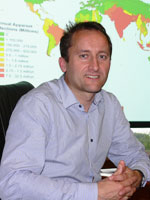
Photo by Cathy
Kristiansen/Fogarty
Dr. Andrew Farlow of
Oxford University
advocated for disease
mapping to improve
research efficiency.
Describing the team's innovation to a seminar hosted recently by the Trans-NIH Global Health Working Group, Dr. Andrew Farlow of Oxford said the initial model to map dengue fever could be applied to many of the 350 infectious diseases currently registered by the Global Infectious Disease and Epidemiology Network. Only about seven have been fairly well mapped by other methods, he noted in his talk, "Disease Mapping and the Economics of Vaccines: Opportunities and Challenges."
One of the NIH working group's areas of interest is exploring innovations and translational research to improve health in low- and middle-income countries. The quality of epidemiological data is often minimal in these locations, undermining the ability of authorities to efficiently support national health care needs.
"How can we intercept a normal risk for routine public health if we don't have maps?" Farlow asked. Once researchers employ tools to track disease locations and intensities, they will be better positioned to assess the potential use of new vaccines, and develop incentive structures for vaccine financing in low-resource settings. "We can think of occurrence mapping as predicting the niche of a disease, much like when you predict a niche for a species," Farlow said.
The mapping model compiles input factors, which vary depending on the disease. For the dengue model, the Oxford team included population density and movement, vegetation and urbanization because the main vector mosquito thrives in heavily populated environments. The model also includes precipitation data collected by satellite and temperature records, and incorporates the life cycle of the dengue parasite. Poverty plays a role, too.
"By putting all these things together, we can create a map that predicts the probability of occurrence of an infectious disease," he said. "Based on the results, we can target more effective surveillance strategies."
Their first model identified dengue's presence in 128 countries, including 36 previously classified as dengue-free by the WHO. The preliminary estimate for the global population at risk put it as high as 3.97 billion. Producing the map for dengue was expensive, requiring five years of work, 15 staffers and 22,000 parasite rate surveys, but with each mapping exercise the cost declines.
"We're creating a framework for lots of diseases," Farlow said, adding the group's second project, on malaria from Plasmodium vivax, has 10 staff and about 10,000 parasite rate surveys. "As the capacity builds up and we use these data banks much more efficiently, the cost of modeling malaria might be one-tenth what it was."
More Information
To view Adobe PDF files,
download current, free accessible plug-ins from Adobe's website.